5. Data Analysis
Each data you send and all the related information (the way the data has been built,
the feedback from the target, and so on) are stored within the fuddly database
(an SQLite database located at <fuddly data folder>/fmkdb.db). They all get a unique ID,
starting from 1 and increasing by 1 each time a data is sent.
5.1. FmkDB Toolkit
To interact with the database a convenient toolkit is provided (<root of fuddly>/tools/fmkdb.py).
5.1.1. Usage Examples
Let’s say you want to look at all the information that have been recorded for one of the data you sent, with the ID 4. The following command will display a synthesis of what you want:
./tools/fmkdb.py -i 4
And if you want to get all information, issue the following:
./tools/fmkdb.py -i 4 --with-data --with-fbk
You can also request information on all data sent between two dates. For instance the following command will display all data information that have been recorded between 25th January 2016 (11:30) and 26th January 2016:
./tools/fmkdb.py --info-by-date 2016/01/25-11:30 2016/01/26
For further information refer to the help by issuing:
./tools/fmkdb.py -h
5.1.2. Fmkdb Toolkit Manual
Hereunder is shown the output of <root of fuddly>/tools/fmkdb.py -h.
usage: fmkdb.py [-h] [--fmkdb PATH] [--no-color] [-v] [--page-width WIDTH]
                [--fbk-src FEEDBACK_SOURCES] [--project PROJECT_NAME]
                [--fbk-status-formula STATUS_REF] [-s] [-i DATA_ID]
                [--info-by-date START END] [-ids FIRST_DATA_ID LAST_DATA_ID] [-wf] [-wd] [-wa]
                [--without-fmkinfo] [--without-analysis] [--limit LIMIT] [--raw] [-dd]
                [-df] [--data-atom ATOM_NAME] [--fbk-atom ATOM_NAME]
                [--force-fbk-decoder DATA_MODEL_NAME]
                [--export-data FIRST_DATA_ID LAST_DATA_ID] [-e DATA_ID]
                [--remove-data FIRST_DATA_ID LAST_DATA_ID] [-r DATA_ID]
                [--data-with-impact] [--data-with-impact-raw] [--data-without-fbk]
                [--data-with-specific-fbk FEEDBACK_REGEXP] [-a IMPACT COMMENT]
                [--disprove-impact FIRST_ID LAST_ID]

Argument for FmkDB toolkit script

optional arguments:
  -h, --help            show this help message and exit

Miscellaneous Options:
  --fmkdb PATH          Path to an alternative fmkDB.db
  --no-color            Do not use colors
  -v, --verbose         Verbose mode
  --page-width WIDTH    Width hint for displaying information

Configuration Handles:
  --fbk-src FEEDBACK_SOURCES
                        Restrict the feedback sources to consider (through a regexp).
                        Supported by: --data-with-impact, --data-without-fbk, --data-with-
                        specific-fbk
  --project PROJECT_NAME
                        Restrict the data to be displayed to a specific project. Supported
                        by: --info-by-date, --info-by-ids, --data-with-impact, --data-
                        without-fbk, --data-with-specific-fbk
  --fbk-status-formula STATUS_REF
                        Restrict the data to be displayed to specific feedback status.
                        This option provides the formula to be used for feedback status
                        filtering (the character "?" should be used in place of the status
                        value that will be checked). Supported by: --data-with-impact

Fuddly Database Visualization:
  -s, --all-stats       Show all statistics

Fuddly Database Information:
  -i DATA_ID, --data-id DATA_ID
                        Provide the data ID on which actions will be performed. Without
                        any other parameters the default action is to display information
                        on the specified data ID.
  --info-by-date START END
                        Display information on data sent between START and END (date
                        format 'Year/Month/Day' or 'Year/Month/Day-Hour' or
                        'Year/Month/Day-Hour:Minute')
  -ids FIRST_DATA_ID LAST_DATA_ID, --info-by-ids FIRST_DATA_ID LAST_DATA_ID
                        Display information on all the data included within the specified
                        data ID range
  -wf, --with-fbk       Display full feedback (expect --data-id)
  -wd, --with-data      Display data content (expect --data-id)
  -wa, --with-async-data
                        Display any related async data (expect --data-id)
  --without-fmkinfo     Do not display fmkinfo (expect --data-id)
  --without-analysis    Do not display user analysis (expect --data-id)
  --limit LIMIT         Limit the size of what is displayed from the sent data and the
                        retrieved feedback (expect --with-data or --with-fbk).
  --raw                 Display data and feedback in raw format

Fuddly Decoding:
  -dd, --decode-data    Decode sent data based on the data model used for the selected
                        data ID or the atome name provided by --atom
  -df, --decode-fbk     Decode feedback based on the data model used for the selected data
                        ID or the atome name provided by --fbk-atom
  --data-atom ATOM_NAME
                        Atom of the data model to be used for decoding the sent data. If
                        not provided, the name of the sent data will be used.
  --fbk-atom ATOM_NAME  Atom of the data model to be used for decoding feedback. If not
                        provided, the default data model decoder will be used (if one
                        exists), or the name of the first registered atom in the data
                        model
  --force-fbk-decoder DATA_MODEL_NAME
                        Decode feedback with the decoder of the data model specified

Fuddly Database Operations:
  --export-data FIRST_DATA_ID LAST_DATA_ID
                        Extract data from provided data ID range
  -e DATA_ID, --export-one-data DATA_ID
                        Extract data from the provided data ID
  --remove-data FIRST_DATA_ID LAST_DATA_ID
                        Remove data from provided data ID range and all related
                        information from fmkDB
  -r DATA_ID, --remove-one-data DATA_ID
                        Remove data ID and all related information from fmkDB

Fuddly Database Analysis:
  --data-with-impact    Retrieve data that negatively impacted a target. Analysis is
                        performed based on feedback status and user analysis if present
  --data-with-impact-raw
                        Retrieve data that negatively impacted a target. Analysis is
                        performed based on feedback status
  --data-without-fbk    Retrieve data without feedback
  --data-with-specific-fbk FEEDBACK_REGEXP
                        Retrieve data with specific feedback provided as a regexp
  -a IMPACT COMMENT, --add-analysis IMPACT COMMENT
                        Add an impact analysis to a specific data ID (expect --data-id).
                        IMPACT should be either 0 (no impact) or 1 (impact), and COMMENT
                        provide information
  --disprove-impact FIRST_ID LAST_ID
                        Disprove the impact of a group of data present in the outcomes of
                        '--data-with-impact-raw'. The group is determined by providing the
                        smaller data ID (FIRST_ID) and the bigger data ID (LAST_ID).
5.2. Plotty
Plotty is a tool used to vizualize data from the fmkDB.
To interact with the database a convenient toolkit is provided (<root of fuddly>/tools/plotty/*).
5.2.1. Usage Examples
A very common usage is just to plot the data relatively to the date it was sent at.
To do that, you can use the plotty CLI, at <root of fuddly>/tools/plotty/plotty.py:
./tools/plotty.py -ids '0..100|2'
Plots the SEND_DATE in function of the ID of every message which has en even ID beetween 0 and 100. A lot of display and formatting options are available to build your own plotting experience ♥‿♥
For further information refer to the help by issuing:
./tools/plotty/plotty.py -h
5.2.2. Plotty Manual
Hereunder is shown the output of <root of fuddly>/tools/plotty/plotty.py -h
usage: plotty.py [-h] -ids ID_RANGE [-df DATE_FORMAT] [-db PATH [PATH ...]] [-f FORMULA] [-poi POINTS_OF_INTEREST] [-gm {all,poi,auto}] [-hp]
           [-l ANNOTATIONS [ANNOTATIONS ...]] [-al ASYNC_ANNOTATIONS [ASYNC_ANNOTATIONS ...]] [-o OTHER_ID_RANGE] [-s VERTICAL_SHIFT]

Arguments for Plotty

options:
  -h, --help            show this help message and exit

Main parameters:
  -ids ID_RANGE, --id-range ID_RANGE
                        The ID range to take into account should be: either <id_start>..<id_stop>[|<step>], or <id_start_1>..<id_stop_1>[|<step_1>], ...,
                        <id_start_n>..<id_stop_n>[|<step_n>]
  -df DATE_FORMAT, --date-format DATE_FORMAT
                        Wanted date format, in a strftime format (1989 C standard). Default is %H:%M:%S.%f
  -db PATH [PATH ...], --fmkdb PATH [PATH ...]
                        Path to any fmkDB.db files. There can be many if using the --other_id_range option. Default is fuddly/data/directory/fmkDB.db

Display Options:
  -f FORMULA, --formula FORMULA
                        The formula to plot, in the form "y ~ x"
  -poi POINTS_OF_INTEREST, --points-of-interest POINTS_OF_INTEREST
                        How many point of interest the plot should show. Default is none
  -gm {all,poi,auto}, --grid-match {all,poi,auto}
                        Should the plot grid specifically match some element. Possible options are 'all', 'poi' and 'auto'. Default is 'all'
  -hp, --hide-points    Should the graph display every point above the line, or just the line. Default is to display the points

Labels Configuration:
  -l ANNOTATIONS [ANNOTATIONS ...], --labels ANNOTATIONS [ANNOTATIONS ...]
                        Display the specified labels for each Data ID represented in the curve. ('t' for TYPE, 'g' for TARGET, 's' for SIZE, 'a' for
                        ACK_DATE)
  -al ASYNC_ANNOTATIONS [ASYNC_ANNOTATIONS ...], --async-labels ASYNC_ANNOTATIONS [ASYNC_ANNOTATIONS ...]
                        Display the specified labels for each Async Data ID represented in the curve. ('i' for 'ID', 't' for TYPE, 'g' for TARGET, 's' for
                        SIZE)

Multiple Curves Options:
  -o OTHER_ID_RANGE, --other-id-range OTHER_ID_RANGE
                        Other ranges of IDs to plot against the main one. All other options apply to it
  -s VERTICAL_SHIFT, --vertical-shift VERTICAL_SHIFT
                        When --other-id-range is used, specify the spacing between the curves. The shift is computed as the multiplication between the
                        original curve height and this value
5.2.3. Concrete output example
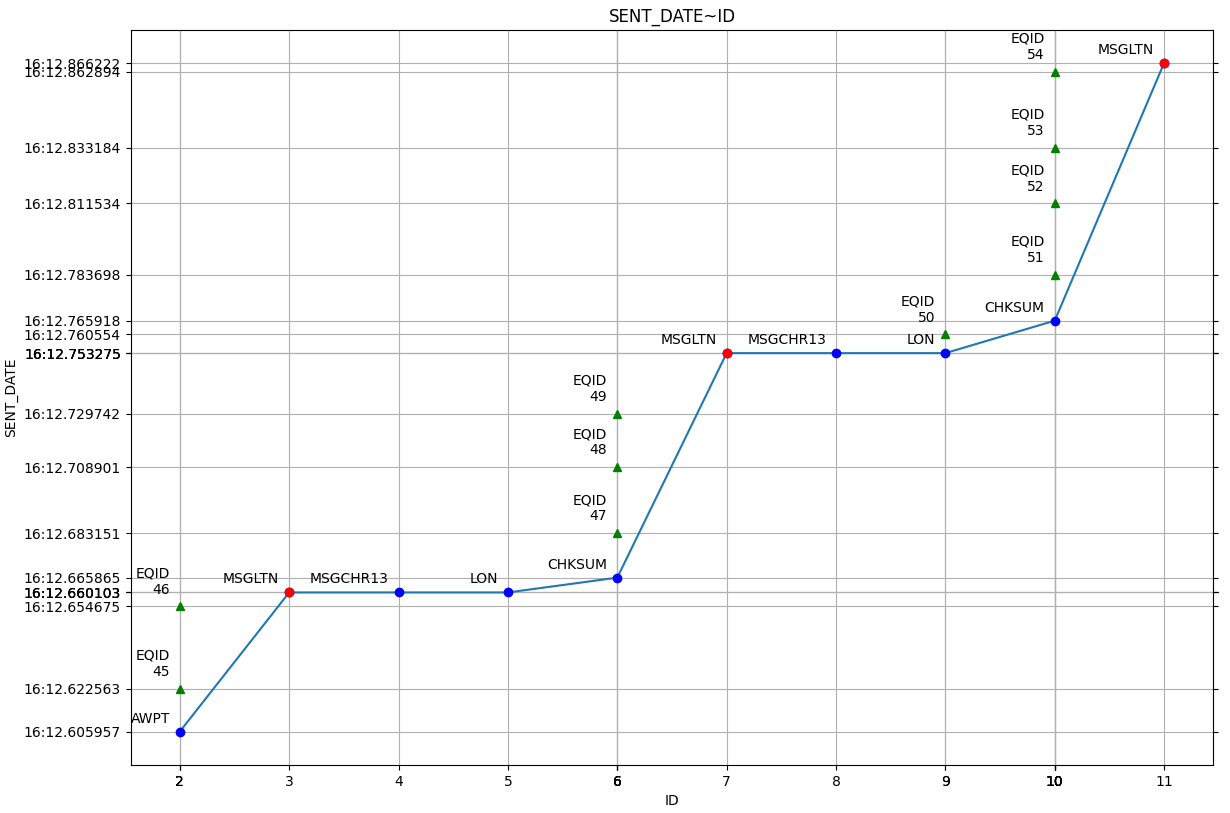
Example of curve comparison using Plotty
Given a simple command line:
./tools/plotty/plotty.py -id '2..12' -l t -al t i -df "%M:%S.%f" -poi 3
It is already possible to vizualize trends, behaviors and anomalies. Comparison becomes easier !